

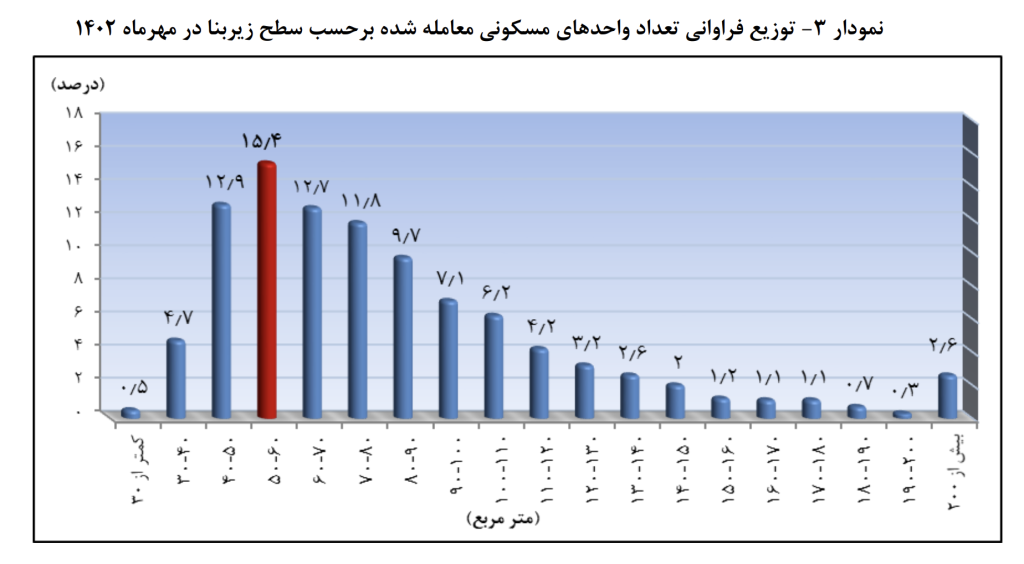
In this article, we want to talk about the frequency analysis of the number of residential units traded in the real estate market according to the level below the building in Mehr 1402.
According to the diagram, in the market, supply and demand for 50-60 meter units has the largest share. This shows that in the Tehran housing market, the demand for smaller units is higher. This may be due to the overall lower price of these units, which is more appealing to buyers on a tighter budget.
After that, units with 50-40 and 70-60 square meters share almost equally in the trading market. This shows that despite the high demand for smaller units, there is still significant demand for medium-sized units.
After that, units with 70-80 square meters are in the third category. This shows that as the unit size increases, the demand decreases. However, there is still significant demand for these larger units, which may be due to the specific needs of buyers, such as larger families or people looking for more space for work or entertainment.
Finally, this analysis of the frequency of the number of residential units traded in the housing transaction market according to the floor area of the building in Mehr 1402 shows how the demand is distributed in the Tehran housing market. This information can be useful to buyers, sellers, and investors as it allows them to better understand what types of housing units are in the most demand.
The general buyers of these units are the middle class of the society, although investors usually invest in units with smaller size, which in itself is one of the influencing factors in the trading market of these units. According to the above diagram, as the square footage increases, the percentage of transactions decreases, which indicates the lower supply of units with higher square footage, and also the purchasing power of people for units with higher square footage is less. According to the above diagram, as the square footage increases, the percentage of transactions decreases, which indicates the lower supply of units with higher square footage, and also the purchasing power of people for units with higher square footage is less.